| |
|
|
|
|
|
|
|
|
|
|
|
|
|
|
|
|
|
|
|
|
|
|
|
| |
Perfil Local de Saúde 2018 |
|
|
|
ULS Alto Minho |
|
|
|
|
|
|
|
|
|
|
|
|
|
|
| |
|
|
|
|
|
|
|
|
|
|
|
|
|
|
|
|
|
|
|
|
|
|
|
| |
Índice |
|
|
|
|
|
|
|
|
|
|
|
|
|
|
|
|
|
|
|
|
|
|
| |
|
|
|
|
|
|
|
|
|
|
|
|
|
|
|
|
|
|
|
|
|
|
|
| |
COMO VIVEMOS? |
|
|
|
|
|
|
|
|
|
|
|
|
|
|
| |
Educação |
|
|
|
|
|
|
|
|
|
|
|
|
|
|
|
|
| |
Situação
Perante o Emprego |
|
|
|
|
|
|
|
|
|
|
|
|
|
|
|
|
| |
Suporte
Social |
|
|
|
|
|
|
|
|
|
|
|
|
|
|
|
|
| |
Economia |
|
|
|
|
|
|
|
|
|
|
|
|
|
|
|
|
| |
Ambiente -
Saneamento Básico |
|
|
|
|
|
|
|
|
|
|
|
|
|
|
|
|
| |
Segurança |
|
|
|
|
|
|
|
|
|
|
|
|
|
|
|
|
| |
|
|
|
|
|
|
|
|
|
|
|
|
|
|
|
|
|
|
|
|
|
|
|
| |
Educação |
|
|
|
|
|
|
|
|
|
|
|
|
|
|
| |
|
|
|
|
|
|
|
|
|
|
|
|
|
|
|
|
|
|
|
|
|
|
|
| |
TAXA DE ABANDONO
ESCOLAR (%) E TAXA DE ANALFABETISMO (%), CENSOS 2001 E 2011 |
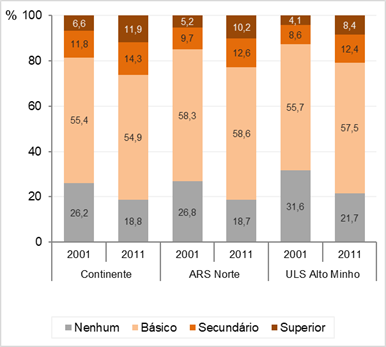
DISTRIBUIÇÃO (%) DA
POPULAÇÃO RESIDENTE POR NÍVEL DE ESCOLARIDADE MAIS ELEVADO COMPLETO (CENSOS
2001 E 2011) |
|
|
|
|
|
|
|
|
|
|
|
|
|
|
| |
|
|
|
|
|
|
|
|
|
|
|
|
|
|
|
|
|
|
|
|
|
|
|
| |
Local de
Residência |
Taxa de abandono escolar (%) |
Taxa de
analfabetismo (%) |
|
|
|
|
|
|
|
|
|
|
|
|
|
|
|
| |
2001 |
2011 |
2001 |
2011 |
|
|
|
|
|
|
|
|
|
|
|
|
|
|
| |
Continente |
2,7 |
1,5 |
8,9 |
5,2 |
|
|
|
|
|
|
|
|
|
|
|
|
|
|
| |
ARS Norte |
3,5 |
1,4 |
8,3 |
5,0 |
|
|
|
|
|
|
|
|
|
|
|
|
|
|
| |
ULS Alto Minho |
2,3 |
1,4 |
11,6 |
6,8 |
|
|
|
|
|
|
|
|
|
|
|
|
|
|
| |
Arcos de Valdevez |
3,3 |
1,8 |
20,3 |
12,6 |
|
|
|
|
|
|
|
|
|
|
|
|
|
|
| |
Caminha |
1,3 |
1,8 |
7,1 |
4,4 |
|
|
|
|
|
|
|
|
|
|
|
|
|
|
| |
Melgaço |
3,3 |
0,8 |
15,2 |
9,5 |
|
|
|
|
|
|
|
|
|
|
|
|
|
|
| |
Monção |
1,7 |
1,4 |
14,1 |
8,1 |
|
|
|
|
|
|
|
|
|
|
|
|
|
|
| |
Paredes de Coura |
2,4 |
2,3 |
19,8 |
11,4 |
|
|
|
|
|
|
|
|
|
|
|
|
|
|
| |
Ponte da Barca |
1,3 |
1,6 |
16,7 |
11,1 |
|
|
|
|
|
|
|
|
|
|
|
|
|
|
| |
Ponte de Lima |
3,7 |
1,2 |
12,0 |
7,1 |
|
|
|
|
|
|
|
|
|
|
|
|
|
|
| |
Valença |
2,4 |
2,6 |
9,6 |
5,1 |
|
|
|
|
|
|
|
|
|
|
|
|
|
|
| |
Viana do Castelo |
1,5 |
1,2 |
7,5 |
4,4 |
|
|
|
|
|
|
|
|
|
|
|
|
|
|
| |
Vila Nova de Cerveira |
2,9 |
1,0 |
10,6 |
6,1 |
|
|
|
|
|
|
|
|
|
|
|
|
|
|
| |
|
|
|
|
|
|
|
|
|
|
|
|
|
|
|
|
|
|
|
| |
|
|
|
|
|
|
|
|
|
|
|
|
|
|
|
|
|
|
|
| |
|
|
|
|
|
|
|
|
|
|
|
|
|
|
|
|
|
|
|
| |
|
|
|
|
|
|
|
|
|
|
|
|
|
|
|
|
|
|
|
| |
|
|
|
|
|
|
Fonte: Observatórios Regionais de Saúde (dados: INE, IP) |
|
|
|
|
|
|
|
|
|
|
|
|
|
|
| |
|
|
Fonte: Observatórios Regionais de Saúde (dados: INE, IP) |
|
|
|
|
|
|
|
|
|
|
|
|
|
|
|
|
|
|
| |
|
|
|
|
|
|
|
|
|
|
|
|
|
|
|
|
|
|
|
|
|
|
|
| |
Topo |
|
|
|
|
|
|
|
|
|
|
|
|
|
|
|
|
|
|
|
|
|
|
| |
|
|
|
|
|
|
|
|
|
|
|
|
|
|
|
|
|
|
|
|
|
|
|
| |
Situação Perante o Emprego |
|
|
|
|
|
|
|
|
|
|
|
|
|
|
| |
|
|
|
|
|
|
|
|
|
|
|
|
|
|
|
|
|
|
|
|
|
|
|
| |
NÚMERO DE
DESEMPREGADOS INSCRITOS NO INSTITUTO DE EMPREGO E FORMAÇÃO PROFISSIONAL
(IEFP), VARIAÇÃO HOMÓLOGA E DESEMPREGADOS INSCRITOS POR 1000 HABITANTES DA
POPULAÇÃO ATIVA (15+ ANOS) |
EVOLUÇÃO MENSAL DO
NÚMERO DE DESEMPREGADOS INSCRITOS NO INSTITUTO DE EMPREGO E FORMAÇÃO
PROFISSIONAL (IEFP) NA ULS ALTO MINHO , POR GÉNERO (JAN-04 A DEZ-17) |
|
|
|
|
|
|
|
|
|
|
|
|
|
|
| |
|
|
|
|

|
|
|
|
|
|
|
|
|
|
|
|
|
|
|
|
|
|
|
| |
Local de Residência |
dez/15 |
dez/16 |
dez/17 |
|
|
|
|
|
|
|
|
|
|
|
|
|
|
|
|
|
|
|
| |
Número de desempregados inscritos no IEFP |
|
|
|
|
|
|
|
|
|
|
|
|
|
|
|
|
|
|
|
| |
Continente |
521 611 |
452 652 |
377 791 |
|
|
|
|
|
|
|
|
|
|
|
|
|
|
|
|
|
|
|
| |
ARS Norte |
230 702 |
200 491 |
169 011 |
|
|
|
|
|
|
|
|
|
|
|
|
|
|
|
|
|
|
|
| |
ULS Alto Minho |
10 295 |
8 440 |
6 110 |
|
|
|
|
|
|
|
|
|
|
|
|
|
|
|
|
|
|
|
| |
Homens |
5 050 |
4 139 |
2 989 |
|
|
|
|
|
|
|
|
|
|
|
|
|
|
|
|
|
|
|
| |
Mulheres |
5 245 |
4 301 |
3 121 |
|
|
|
|
|
|
|
|
|
|
|
|
|
|
|
|
|
|
|
| |
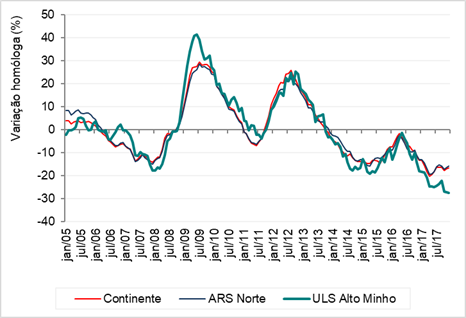
Variação
homóloga* do nº de desempregados inscritos no IEFP |
|
|
|
|
|
|
|
|
|
|
|
|
|
|
|
|
|
|
|
| |
Continente |
-7,6 |
-13,2 |
-16,5 |
|
|
|
|
|
|
|
|
|
|
|
|
|
|
|
|
|
|
|
| |
ARS Norte |
-8,9 |
-13,1 |
-15,7 |
|
|
|
|
|
|
|
|
|
|
|
|
|
|
|
|
|
|
|
| |
ULS Alto Minho |
-8,1 |
-18,0 |
-27,6 |
|
|
|
|
|
|
|
|
|
|
|
|
|
|
|
|
|
|
|
| |
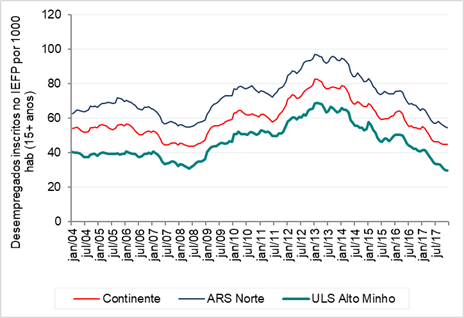
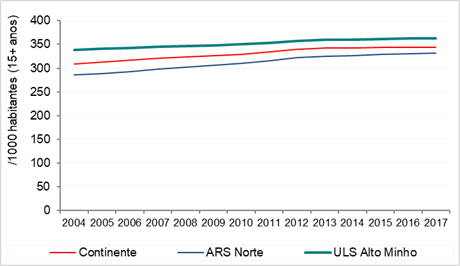
Desempregados
inscritos no IEFP / 1000 habitantes (15+ anos) |
|
|
|
|
|
|
|
|
|
|
|
|
|
|
|
|
|
|
|
| |
Continente |
61,7 |
53,6 |
44,7 |
|
|
|
|
|
|
|
|
|
|
|
|
|
|
|
|
|
|
|
| |
ARS Norte |
74,2 |
64,7 |
54,5 |
|
|
|
|
|
|
|
|
|
|
|
|
|
|
|
|
|
|
|
| |
ULS Alto Minho |
49,6 |
41,0 |
29,8 |
|
|
|
|
|
|
|
|
|
|
|
|
|
|
|
|
|
|
|
| |
|
Fonte: Observatórios Regionais de Saúde (dados: IEFP, IP) |
|
|
|
|
|
|
|
|
|
|
|
|
|
|
|
|
|
|
|
| |
* É a variação do
número médio de desempregados inscritos nos Centros de Emprego face ao mês
homólogo do ano anterior |
|
|
|
Fonte: Observatórios Regionais de Saúde (dados: IEFP, IP) |
|
|
|
|
|
|
|
|
|
|
|
|
|
|
| |
|
|
|
|
|
|
|
|
|
|
|
|
|
|
|
|
|
|
|
|
|
|
|
| |
VARIAÇÃO HOMÓLOGA* DO
NÚMERO DE DESEMPREGADOS INSCRITOS NO INSTITUTO DE EMPREGO E FORMAÇÃO
PROFISSIONAL (IEFP) NO CONTINENTE, NA ARS NORTE E NA ULS ALTO MINHO (JAN-05 A
DEZ-17) |
EVOLUÇÃO MENSAL DOS
DESEMPREGADOS INSCRITOS NO INSTITUTO DE EMPREGO E FORMAÇÃO PROFISSIONAL
(IEFP) / 1000 HABITANTES DA POPULAÇÃO ATIVA (15+ ANOS) NO CONTINENTE, NA ARS
NORTE E NA ULS ALTO MINHO (JAN-04 A DEZ-17) |
|
|
|
|
|
|
|
|
|
|
|
|
|
|
| |
|
|
|
|
|
|
|
|
|
|
|
|
|
|
|
|
|
|
|
|
|
|
|
| |
|
|
|
|
|
|
|
|
|
|
|
|
|
|
|
|
| |
|
|
|
|
|
|
|
|
|
|
|
|
|
|
| |
|
|
|
|
|
|
|
|
|
|
|
|
|
|
| |
|
|
|
|
|
|
|
|
|
|
|
|
|
|
| |
|
|
|
|
|
|
|
|
|
|
|
|
|
|
| |
|
|
|
|
|
|
|
|
|
|
|
|
|
|
| |
|
|
|
|
|
|
|
|
|
|
|
|
|
|
| |
|
|
|
|
|
|
|
|
|
|
|
|
|
|
| |
|
|
|
|
|
|
|
|
|
|
|
|
|
|
| |
|
|
|
|
|
|
|
|
|
|
|
|
|
|
| |
|
|
|
|
|
|
|
|
|
|
|
|
|
|
| |
|
|
|
|
|
|
|
|
|
|
|
|
|
|
| |
|
|
|
|
|
|
|
|
|
|
|
|
|
|
| |
|
|
|
|
|
|
|
|
|
|
|
|
|
|
| |
|
|
|
|
|
|
|
|
|
|
|
|
|
|
| |
|
Fonte: Observatórios Regionais de Saúde (dados: IEFP, IP) |
|
|
Fonte: Observatórios Regionais de Saúde (dados: IEFP, IP) |
|
|
|
|
|
|
|
|
|
|
|
|
|
|
| |
* É a variação do
número médio de desempregados inscritos nos Centros de Emprego face ao mês
homólogo do ano anterior |
|
|
|
|
|
|
|
|
|
|
|
|
|
|
|
|
|
|
|
|
| |
Topo |
|
|
|
|
|
|
|
|
|
|
|
|
|
|
|
|
|
|
| |
|
|
|
|
|
|
|
|
|
|
|
|
|
|
|
|
|
|
|
|
|
|
|
| |
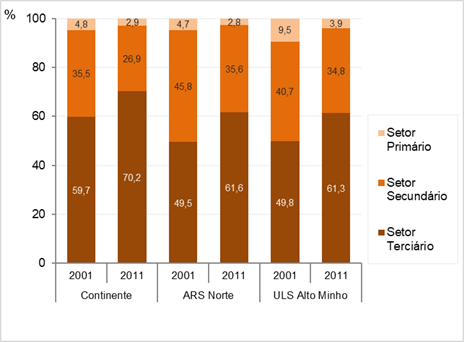
DISTRIBUIÇÃO (%) DA
POPULAÇÃO EMPREGADA POR SETOR DE ATIVIDADE ECONÓMICA (CENSOS 2001 E 2011) |
DISTRIBUIÇÃO (%) DA
POPULAÇÃO EMPREGADA POR SETOR DE ATIVIDADE ECONÓMICA (CENSOS 2001 E 2011) |
|
|
|
|
|
|
|
|
|
|
|
|
|
|
| |
|
|
|
|
|
|
|
|
|
|
|
|
|
|
|
|
|
|
|
|
|
|
|
| |
Local de Residência |
Setor Primário |
Setor
Secundário |
Setor Terciário |
|
|
|
|
|
|
|
|
|
|
|
|
|
|
|
|
|
|
|
| |
Censos 2001 |
|
|
|
|
|
|
|
|
|
|
|
|
|
|
|
|
|
|
|
| |
Continente |
4,8 |
35,5 |
59,7 |
|
|
|
|
|
|
|
|
|
|
|
|
|
|
|
|
|
|
|
| |
ARS Norte |
4,7 |
45,8 |
49,5 |
|
|
|
|
|
|
|
|
|
|
|
|
|
|
|
|
|
|
|
| |
ULS Alto Minho |
9,5 |
40,7 |
49,8 |
|
|
|
|
|
|
|
|
|
|
|
|
|
|
|
|
|
|
|
| |
Censos 2011 |
|
|
|
|
|
|
|
|
|
|
|
|
|
|
|
|
|
|
|
| |
Continente |
2,9 |
26,9 |
70,2 |
|
|
|
|
|
|
|
|
|
|
|
|
|
|
|
|
|
|
|
| |
ARS Norte |
2,8 |
35,6 |
61,6 |
|
|
|
|
|
|
|
|
|
|
|
|
|
|
|
|
|
|
|
| |
ULS Alto Minho |
3,9 |
34,8 |
61,3 |
|
|
|
|
|
|
|
|
|
|
|
|
|
|
|
|
|
|
|
| |
|
Fonte: Observatórios Regionais de Saúde (dados: INE, IP) |
|
|
|
|
|
|
|
|
|
|
|
|
|
|
|
|
|
|
|
| |
|
|
|
|
|
|
|
|
|
|
|
|
|
|
|
|
|
|
|
|
|
|
|
| |
|
|
|
|
|
|
|
|
|
|
|
|
|
|
|
|
|
|
|
|
|
|
|
| |
|
|
|
|
|
|
|
|
|
|
|
|
|
|
|
|
|
|
|
|
|
|
|
| |
|
|
|
|
|
|
|
|
|
|
|
|
|
|
|
|
|
|
|
|
|
|
|
| |
|
|
|
|
|
|
|
|
|
|
|
|
|
|
|
|
|
|
|
|
|
|
|
| |
Topo |
|
|
|
|
|
Fonte: Observatórios Regionais de Saúde (dados: INE, IP) |
|
|
|
|
|
|
|
|
|
|
|
|
|
|
| |
|
|
|
|
|
|
|
|
|
|
|
|
|
|
|
|
|
|
|
|
|
| |
Suporte Social |
|
|
|
|
|
|
|
|
|
|
|
|
|
|
| |
|
|
|
|
|
|
|
|
|
|
|
|
|
|
|
|
|
|
|
|
|
|
|
| |
INDICADORES DE SUPORTE SOCIAL, 2017 |
|
|
|
|
|
|
|
|
|
|
|
|
|
|
| |
|
|
|
|
|
|
|
|
|
|
|
|
|
|
|
|
|
|
|
|
|
|
|
| |
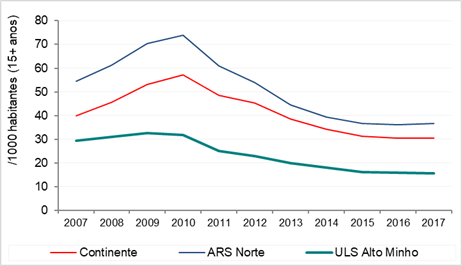
Local de Residência |
Rendimento Social de Inserção [a.] |
Pensionistas da Segurança
Social [a.] |
Subsídios de Desemprego da Segurança
Social [b.] |
|
|
|
|
|
|
|
|
|
|
|
|
|
|
|
| |
Número
de beneficiários |
Proporção
da população (‰, 15+ anos) |
Número
de pensionistas |
Proporção da
população (‰, 15+ anos) |
Valor
médio anual (€) |
Número
de beneficiários |
Proporção da
população (‰, 15+ anos) |
|
|
|
|
|
|
|
|
|
|
|
|
|
|
|
| |
Continente |
258 194 |
30,6 |
2 902 386 |
343,8 |
5 310 |
141 706 |
16,8 |
|
|
|
|
|
|
|
|
|
|
|
|
|
|
|
| |
ARS Norte |
113 446 |
36,6 |
1 027 580 |
331,1 |
4 918 |
53 947 |
17,4 |
|
|
|
|
|
|
|
|
|
|
|
|
|
|
|
| |
ULS Alto Minho |
3 220 |
15,7 |
74 392 |
362,4 |
4 112 |
2 207 |
10,7 |
|
|
|
|
|
|
|
|
|
|
|
|
|
|
|
| |
|
Fonte: Observatórios Regionais de Saúde (dados: a. INE, IP; b.
PORDATA) |
|
|
|
|
|
|
|
|
|
|
|
|
|
|
|
| |
|
|
|
|
|
|
|
|
|
|
|
|
|
|
|
|
|
|
|
|
|
|
|
| |
EVOLUÇÃO DOS
BENEFICIÁRIOS DO RENDIMENTO SOCIAL DE INSERÇÃO DA SEGURANÇA SOCIAL POR 1000
HABITANTES DA POPULAÇÃO ATIVA (15+ ANOS), 2007-2017 |
EVOLUÇÃO DOS
PENSIONISTAS DA SEGURANÇA SOCIAL /1000 HABITANTES DA POPULAÇÃO ATIVA (15+
ANOS), 2004-2017 |
|
|
|
|
|
|
|
|
|
|
|
|
|
|
| |
|
|
|
|
|
|
|
|
|
|
|
|
|
|
|
|
|
|
|
|
|
|
|
| |
|
|
|
|
|
|
|
|
|
|
|
|
|
|
|
|
| |
|
|
|
|
|
|
|
|
|
|
|
|
|
|
| |
|
|
|
|
|
|
|
|
|
|
|
|
|
|
| |
|
|
|
|
|
|
|
|
|
|
|
|
|
|
| |
|
|
|
|
|
|
|
|
|
|
|
|
|
|
| |
|
|
|
|
|
|
|
|
|
|
|
|
|
|
| |
|
|
|
|
|
|
|
|
|
|
|
|
|
|
| |
|
|
|
|
|
|
|
|
|
|
|
|
|
|
| |
|
|
|
|
|
|
|
|
|
|
|
|
|
|
| |
|
|
|
|
|
|
|
|
|
|
|
|
|
|
| |
|
|
|
|
|
|
|
|
|
|
|
|
|
|
| |
|
|
|
|
|
|
|
|
|
|
|
|
|
|
| |
|
|
|
|
|
|
|
|
|
|
|
|
|
|
| |
|
|
|
|
|
|
|
|
|
|
|
|
|
|
| |
|
Fonte: Observatórios Regionais de Saúde (dados: INE, IP) |
|
|
Fonte: Observatórios Regionais de Saúde (dados: INE, IP) |
|
|
|
|
|
|
|
|
|
|
|
|
|
|
| |
Topo |
|
|
|
|
|
|
|
|
|
|
|
|
|
|
|
|
|
|
|
|
|
|
| |
|
|
|
|
|
|
|
|
|
|
|
|
|
|
|
|
|
|
|
|
|
|
|
| |
Economia |
|
|
|
|
|
|
|
|
|
|
|
|
|
|
| |
|
|
|
|
|
|
|
|
|
|
|
|
|
|
|
|
|
|
|
|
|
|
|
| |
GANHO MÉDIO MENSAL DE TRABALHADORES POR CONTA DE
OUTREM E PODER DE COMPRA PER CAPITA |
|
|
|
|
|
|
|
|
|
|
|
|
|
|
| |
|
|
|
|
|
|
|
|
|
|
|
|
|
|
|
|
|
|
|
|
|
|
|
| |
Local de Residência |
Ganho médio mensal de trabalhadores por conta
de outrem (€) [a.] |
Poder de Compra per capita [b.] |
|
|
|
|
|
|
|
|
|
|
|
|
|
|
| |
2005 |
2008 |
2011 |
2014 |
1993 |
2000 |
2007 |
2015 |
|
|
|
|
|
|
|
|
|
|
|
|
|
|
| |
Continente |
909,2 |
1 010,4 |
1 084,6 |
1 093,2 |
101,8 |
101,7 |
100,5 |
100,7 |
|
|
|
|
|
|
|
|
|
|
|
|
|
|
| |
ARS Norte |
751,7 |
832,6 |
949,1 |
967,2 |
81,7 |
86,0 |
86,2 |
92,1 |
|
|
|
|
|
|
|
|
|
|
|
|
|
|
| |
ULS Alto Minho |
673,8 |
748,6 |
860,8 |
881,1 |
55,3 |
61,1 |
71,2 |
79,9 |
|
|
|
|
|
|
|
|
|
|
|
|
|
|
| |
Arcos de Valdevez |
623,8 |
699,4 |
764,5 |
797,3 |
36,5 |
41,3 |
52,4 |
68,8 |
|
|
|
|
|
|
|
|
|
|
|
|
|
|
| |
Caminha |
688,2 |
812,3 |
854,9 |
833,4 |
78,2 |
75,3 |
77,4 |
80,6 |
|
|
|
|
|
|
|
|
|
|
|
|
|
|
| |
Melgaço |
607,9 |
708,9 |
753,1 |
782,5 |
50,4 |
51,2 |
55,3 |
64,2 |
|
|
|
|
|
|
|
|
|
|
|
|
|
|
| |
Monção |
580,9 |
701,8 |
768,1 |
800,9 |
43,5 |
49,2 |
60,9 |
70,2 |
|
|
|
|
|
|
|
|
|
|
|
|
|
|
| |
Paredes de Coura |
578,0 |
814,9 |
740,0 |
738,2 |
27,5 |
42,5 |
54,9 |
65,0 |
|
|
|
|
|
|
|
|
|
|
|
|
|
|
| |
Ponte da Barca |
601,2 |
718,0 |
789,5 |
793,5 |
43,0 |
51,9 |
51,0 |
64,8 |
|
|
|
|
|
|
|
|
|
|
|
|
|
|
| |
Ponte de Lima |
617,2 |
705,4 |
751,2 |
789,5 |
29,5 |
45,3 |
58,5 |
69,6 |
|
|
|
|
|
|
|
|
|
|
|
|
|
|
| |
Valença |
645,2 |
792,4 |
862,9 |
853,9 |
71,4 |
66,0 |
76,2 |
84,9 |
|
|
|
|
|
|
|
|
|
|
|
|
|
|
| |
Viana do Castelo |
727,8 |
848,0 |
944,1 |
949,6 |
76,9 |
80,1 |
88,4 |
93,7 |
|
|
|
|
|
|
|
|
|
|
|
|
|
|
| |
Vila Nova de Cerveira |
665,3 |
830,7 |
905,5 |
1 013,3 |
55,3 |
54,2 |
77,8 |
82,7 |
|
|
|
|
|
|
|
|
|
|
|
|
|
|
| |
|
|
|
|
|
|
|
|
|
|
|
|
|
|
|
|
|
|
|
|
|
|
|
| |
|
|
|
|
|
|
|
|
|
|
|
|
|
|
|
|
|
|
|
|
|
|
|
| |
|
|
|
|
|
|
|
|
|
|
|
|
|
|
|
|
|
|
|
|
|
|
|
| |
|
|
|
|
|
|
|
|
|
|
|
|
|
|
|
|
|
|
|
|
|
|
|
| |
|
|
|
|
|
|
|
|
|
|
|
|
|
|
|
|
|
|
|
|
|
|
|
| |
a. Até 2012, valor para
a NUTS II (2001). A partir de 2013, valor para a NUTS II (2013). |
|
|
Fonte: Observatórios Regionais de Saúde (dados: INE, IP) |
|
|
|
|
|
|
|
|
|
|
|
|
|
|
| |
b. Até 2002, valor para
a NUTS II (2001). A partir de 2004, valor para a NUTS II (2013). |
|
|
|
|
|
|
|
|
|
|
|
|
|
|
|
|
|
|
|
| |
|
|
|
|
|
|
|
|
|
|
|
|
|
|
|
|
|
|
|
|
|
|
|
| |
Topo |
|
|
|
|
|
|
|
|
|
|
|
|
|
|
|
|
|
|
|
|
|
|
| |
|
|
|
|
|
|
|
|
|
|
|
|
|
|
|
|
|
|
|
|
|
|
|
| |
Ambiente - Saneamento Básico e Resíduos |
|
|
|
|
|
|
|
|
|
|
|
|
|
|
| |
|
|
|
|
|
|
|
|
|
|
|
|
|
|
|
|
|
|
|
|
|
|
|
| |
INDICADORES ABASTECIMENTO DE ÁGUA, ÁGUAS RESIDUAIS
E RESÍDUOS |
|
|
|
|
|
|
|
|
|
|
|
|
|
|
| |
|
|
|
|
|
|
|
|
|
|
|
|
|
|
|
|
|
|
|
|
|
|
|
| |
Local de Residência |
Proporção de Alojamentos (%) servidos por |
Resíduos urbanos |
|
|
|
|
|
|
|
|
|
|
|
|
|
|
|
|
| |
abastecimento
de água, 2017 |
drenagem
de águas residuais, 2017 |
recolhidos por habitante (kg/ hab.), 2017 |
recolhidos
seletivamente por habitante
(kg/ hab.), 2017 |
|
|
|
|
|
|
|
|
|
|
|
|
|
|
|
|
|
|
| |
|
|
|
|
|
|
|
|
|
|
|
|
|
|
|
| |
Continente |
96 |
85 |
484 |
88 |
|
|
|
|
|
|
|
|
|
|
|
|
|
|
|
|
|
|
| |
ARS Norte |
91 |
76 |
441 |
66 |
|
|
|
|
|
|
|
|
|
|
|
|
|
|
|
|
|
|
| |
ULS Alto Minho |
83 |
56 |
440 |
57 |
|
|
|
|
|
|
|
|
|
|
|
|
|
|
|
|
|
|
| |
Fonte: Observatórios Regionais de Saúde (dados:
INE, IP) |
|
|
|
|
|
|
|
|
|
|
|
|
|
|
|
|
|
|
| |
|
|
|
|
|
|
|
|
|
|
|
|
|
|
|
|
|
|
|
|
|
|
|
| |
Topo |
|
|
|
|
|
|
|
|
|
|
|
|
|
|
|
|
|
|
|
|
|
|
| |
|
|
|
|
|
|
|
|
|
|
|
|
|
|
|
|
|
|
|
|
|
|
|
| |
Segurança |
|
|
|
|
|
|
|
|
|
|
|
|
|
|
| |
|
|
|
|
|
|
|
|
|
|
|
|
|
|
|
|
|
|
|
|
|
|
|
| |
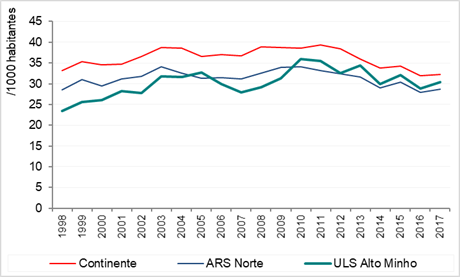
INDICADORES DE CRIMINALIDADE (2007, 2012, 2017) |
EVOLUÇÃO DA TAXA DE
CRIMINALIDADE (/1000 HABITANTES), 1998-2017 |
|
|
|
|
|
|
|
|
|
|
|
|
|
|
| |
|
|
|
|
|
|
|
|
|
|
|
|
|
|
|
|
|
|
|
|
|
|
|
| |
Local de Residência |
2007 |
2012 |
2017 |
|
|
|
|
|
|
|
|
|
|
|
|
|
|
|
|
|
|
|
| |
Taxa de Criminalidade (/1000 habitantes) |
|
|
|
|
|
|
|
|
|
|
|
|
|
|
|
|
|
|
|
| |
Continente |
36,7 |
38,5 |
32,2 |
|
|
|
|
|
|
|
|
|
|
|
|
|
|
|
|
|
|
|
| |
ARS Norte |
31,2 |
32,4 |
28,7 |
|
|
|
|
|
|
|
|
|
|
|
|
|
|
|
|
|
|
|
| |
ULS Alto Minho |
27,8 |
32,5 |
30,5 |
|
|
|
|
|
|
|
|
|
|
|
|
|
|
|
|
|
|
|
| |
Taxa de
crimes contra a integridade física (/1000 habitantes) |
|
|
|
|
|
|
|
|
|
|
|
|
|
|
|
|
|
|
|
| |
Continente |
5,5 |
5,2 |
4,7 |
|
|
|
|
|
|
|
|
|
|
|
|
|
|
|
|
|
|
|
| |
ARS Norte |
5,5 |
5,2 |
3,8 |
|
|
|
|
|
|
|
|
|
|
|
|
|
|
|
|
|
|
|
| |
ULS Alto Minho |
4,7 |
4,7 |
4,6 |
|
|
|
|
|
|
|
|
|
|
|
|
|
|
|
|
|
|
|
| |
Taxa de
condução com alcoolemia superior a 1,2 (/1000 habitantes) |
|
|
|
|
|
|
|
|
|
|
|
|
|
|
|
|
|
|
|
| |
Continente |
1,9 |
2,4 |
1,6 |
|
|
|
|
|
|
|
|
|
|
|
|
|
|
|
|
|
|
|
| |
ARS Norte |
1,5 |
1,9 |
1,1 |
|
|
|
|
|
|
|
|
|
|
|
|
|
|
|
|
|
|
|
| |
ULS Alto Minho |
2,3 |
2,4 |
1,7 |
|
|
|
|
|
|
|
|
|
|
|
|
|
|
|
|
|
|
|
| |
|
Fonte: Observatórios Regionais de Saúde (dados: INE, iP) |
|
|
|
|
|
|
|
|
|
|
|
|
|
|
|
|
|
|
|
| |
|
|
|
|
|
|
|
|
|
|
|
|
|
|
|
|
|
|
|
|
|
|
|
| |
Topo |
|
|
|
|
|
Fonte: Observatórios Regionais de Saúde (dados: INE, IP) |
|
|
|
|
|
|
|
|
|
|
|
|
|
|
| |
|
|
|
|
|
|
|
|
|
|
|
|
|
|
|
|
|
|
|
|
|
|
|
| |
|
|
|
|
|
|
|
|
|
|
|
|
|
|
|
|
|
|
|
|
|
|
|
| |
|
|
|
|
|
|
|
|
|
|
|
|
|
|
|
|
|
|
|
| |
|
|
|
|
|
|
|
|
|
|
|
|
|
|
|
|
|
| |
|
|
|
|
|
|
|
|
|
|
|
|
|
|
|
|
|
| |
|
|
|
|
|
|
|
|
|
|
|
|
|
|
|
|
|
|
|
|
|
|
|
|
|
|
|
|
|
|
|
|
|
|
|
|
|
|
|